Script: Heating curves from temp-time data
Identify peaks in raw thermocouple data files and pull out heating curves.
Thermocouples are cool. They allow us to measure big changes in temperature with little effort. But wildland fire scientists must often deploy thermocouple dataloggers well before the flame front approaches them–often hours before the first driptorch is even lit–and it can be hours after mop-up before they can finally be retrieved.
Long deployment times mean that the few seconds of interesting information on fire behavior in our data files are buried among hours of useless data recording only the ambient temperature.
Unfortunately programming, hardware, and ultimately budget prevent many researchers from having dataloggers turn on and off right around the passage of the flame front, so there’s no escaping sorting through those hours of ambient data.
Even more unfortunately, it is surprisingly difficult to filter raw thermocouple data with simple data wrangling techniques. One might just filter out a minute or two on either side of peak values, but a lot of noise can enter thermocouple data files, especially if the sensors are being uncoupled and re-coupled while the unit is logging.
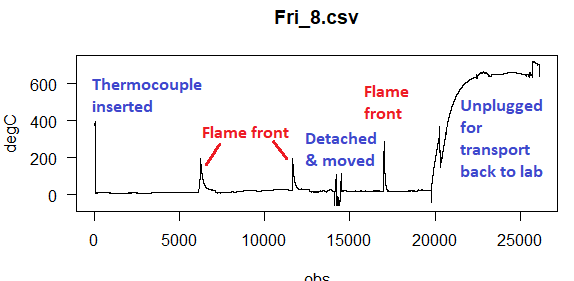
For example, look at this file from an Onset HOBO data logger deployed three times in one afternoon:

The file clearly contains the three peaks from the passage of each flame front, but not one represents the highest values stored in the file. Plugging and unplugging the thermocouple sensors introduced data into the file on three events.
While I can’t figure out how to automate the process fully on account of this noise, I present here a basic R function to take some of the tedium out of grabbing the meaningful information out of so much useless data.
The function proceeds as follows:
- Fetch a list of thermocouple data files in a folder identified by a file path.
- Pop up an
x11()window with the time-temperature relationship in the file. - Allow the user to click on the start and end of each flame peak and store those values.
- Drop all data outside of these rough windows.
- Drop all data within the windows that falls below a user-specified temperature minimum.1
- Cuts off all data after the maximum temperature for each peak.
- Plot the next file, or…
- … return a
tibbleof heating curve values
As written here the function takes two arguments:
FilePath= path to a folder that contains raw thermocouple data files (.txtor.csv)MinTemp= temperature below which to drop data as ambient readings (I used 30 C)
A few notes, since this function is new and raw:
- As written, this version works specifically for HOBO files with a single data column (because that’s what I was working on when I wrote it). Slight modification will allow it to work on files from multi-sensor systems like FeatherFlame, as well, likely by working through (plotting and clicking) each column in a file before moving to the next file in the named directory.
- It requires the FSA package for the simple
is.even()function. I’m sure there’s a better solution for that task. - Some sort of validation of the rough windows should be incorporated, before moving to the next file.
FP = "C://HOBO/ ... /data/"
# Call:
hc <- GetHeatingCurves(FP, 30)
R pops up an external window2 and a crosshairs.
When one clicks the left mouse button, the identify() function will return the coordinates of the nearest datapoint.
This script identifies the point with a red caret.
Click start and endpoints for each curve.
Tip: aim below the point.
When all peaks have been identified, click Stop, then Stop locator in the upper left. The script will automatically store the endpoints and load up a new graph, or return a prompt in the console if no files remain in the directory.
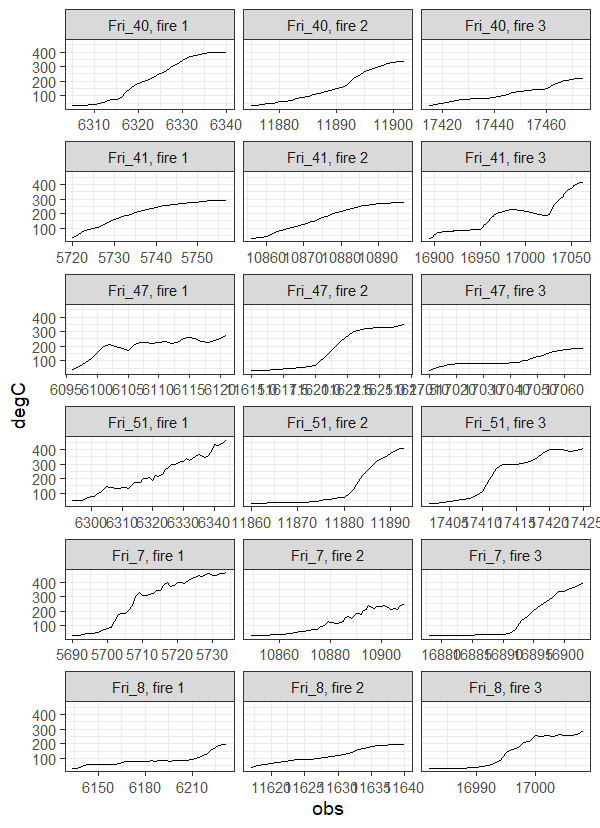
Some script like this allows one to view all of the returned heating curves.
(Note the use of dplyr::unite to simplify the facet labels):
hc %>%
  unite('FileEvent', c(file, event), sep = ", fire ") %>%
  ggplot() + theme_bw(14) +
  geom_line(aes(x = obs, y = degC)) +
  facet_wrap( ~ FileEvent, scales = 'free_x')

The full function:
GetHeatingCurves <- function(FilePath, MinTemp) {
  require(tidyverse)
  require(FSA)
tc_files <- list.files(FilePath)

HeatingCurves <- tibble()

for(i in 1:length(tc_files)){
  rd <-
  paste0(FilePath, tc_files[i]) %>%
    read_csv(skip = 2, col_names = c('obs', 'timestamp', 'degC'))

  x11()
  plot(degC ~ obs, rd,
       type = 'l', las = 1,
       main = tc_files[i])
    pts <- identify(rd$obs,
                    rd$degC,
                    labels = "^",
                    col = "red") ; dev.off()

  events <-
    pts %>%
      as_tibble(rownames = "click") %>%
      rename(obs = value) %>%
      mutate( click = as.numeric(click),
              rough_endpt = ifelse(FSA::is.odd(click), "start", "stop"),
              file = str_remove(tc_files[i], ".csv")) %>%
          group_by(rough_endpt) %>%
          mutate(event = seq(1:n())) %>%
        ungroup() %>%
        select(-click)

  rough_windows <- tibble()
  for(e in 1:length(unique(events$event))) {
    event = filter(events, event == e)
    filter(rd, between(obs, event$obs[1], event$obs[2])) %>%
      mutate(file = str_remove(tc_files[i], ".csv"),
             event = e) %>%
      select(file, event,obs, timestamp, degC) %>%
      bind_rows(rough_windows) -> rough_windows
  }

  rough_windows <- filter(rough_windows, degC >= MinTemp)

  rough_windows %>%
    ggplot() + theme_bw(14) +
      geom_line(aes(x = obs, y = degC)) +
      facet_wrap(~event, scales = 'free_x')

  maxes <-
    rough_windows %>%
        group_by(event, obs) %>%
        summarize(Max = max(degC)) %>%
      slice(which.max(Max)) %>%
        ungroup()

  for(e in 1:max(maxes$event)) {
    m = filter(maxes, event == e)$obs
    rough_windows %>%
    filter(event == e ,
           obs <= m) %>%
      bind_rows(HeatingCurves) %>%
      select(-obs) -> HeatingCurves
  }

}
  return(HeatingCurves)
}
- Why cut off after max temp? We’ve gone over this before [return]
- It is best to use
x11graphics devices, even from Rstudio. [return]